Distance–time graphs are a common topic in GCSE Maths. The key is to understand what the graph is telling you about someone’s journey, then use the graph to calculate distances, times and speeds.
Understanding a distance–time graph
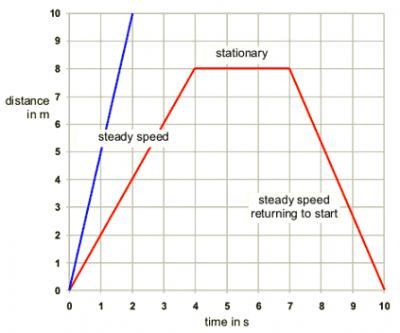
- Horizontal axis (x-axis): time, usually in seconds, minutes or hours.
- Vertical axis (y-axis): distance from the starting point, usually in metres or kilometres.
- A rising line: the person is moving further away.
- A horizontal line: the person is stationary.
- A steeper line: the person is travelling faster.
Remember: time goes along the bottom; distance goes up the side.
The three main types of line

A sloping line upwards
The person is travelling away from the starting point.
If the line is straight, the person is travelling at a constant speed.

A horizontal line
The distance does not change, so the person is stopped.
For example, a horizontal line from 10 to 25 minutes means the person stops for 15 minutes.

A steeper or shallower line
A steeper line means a greater speed. A shallower line means a lower speed.
A line sloping downwards means the person’s distance from the starting point is decreasing — they are returning towards it.
How to calculate speed from a graph
This is one of the most important GCSE exam skills.
The formula is:
\[ \boxed{\text{Speed}=\frac{\text{Distance}}{\text{Time}}} \]
For example, suppose a cyclist travels 12 km in 30 minutes.
Step 1: Write down the distance and time.
- Distance = 12 km
- Time = 30 minutes = 0.5 hours
Step 2: Substitute into the formula.
\[ \text{Speed}=\frac{12}{0.5} \]
Step 3: Calculate the answer.
\[ \boxed{24\text{ km/h}} \]
Exam tip: Check your units. If distance is in kilometres and time is in hours, your speed is in km/h.
Worked GCSE exam question
A person leaves home at 9:00 am and walks to a shop 3 km away, arriving at 9:30 am. They stay at the shop until 10:00 am, then walk home, arriving at 10:45 am.

(a) How long did the person stay at the shop? (1 mark)
From 9:30 am to 10:00 am:
\[ 10{:}00-9{:}30=\boxed{30\text{ minutes}} \]
(b) Calculate the average speed walking to the shop. (2 marks)
Distance = 3 km.
Time = 30 minutes = 0.5 hours.
\[ \text{Speed}=\frac{3}{0.5} \]
\[ \boxed{6\text{ km/h}} \]
(c) Calculate the average speed walking home. (2 marks)
Distance = 3 km.
Time = 45 minutes = 0.75 hours.
\[ \text{Speed}=\frac{3}{0.75} \]
\[ \boxed{4\text{ km/h}} \]
(d) When was the person stationary? (1 mark)
Between 9:30 am and 10:00 am, because the graph is horizontal.
Notice that the person walks home more slowly because the return journey takes longer to cover the same distance.
Real-life graph questions
These questions use graphs to represent everyday situations, not just journeys.
Filling a water tank

- Rising line: water is entering the tank.
- Horizontal line: filling has stopped or the tank is full.
- Steeper line: the water level or volume is increasing faster, if the axes represent volume and time.
Cooling a drink

- Falling line: the temperature is decreasing.
- Horizontal line: the temperature is staying constant.
- A steeper fall means the temperature is decreasing more quickly.
Comparing two journeys

- Compare the gradients to compare speeds.
- An intersection means both people are at the same distance at the same time, provided they use the same starting reference.
How to answer common GCSE exam questions
| Question wording | What you should do |
|---|---|
| Find the distance travelled | Read the distance from the vertical axis, checking whether it means distance from the start or total distance travelled. |
| Find the time taken | Subtract the start time from the finish time. |
| Calculate the average speed | Divide total distance travelled by total time taken. |
| Find when the person stopped | Look for a horizontal section. |
| Who is travelling faster? | Compare the steepness of the lines. |
| Describe the journey | Explain each section in order, mentioning movement, stops and returns. |
| Find the distance at a particular time | Start at the time on the horizontal axis and read up to the graph, then across to the distance axis. |
A useful rule for describing a journey
Read the graph from left to right and describe what happens at each section. For example:
“The person travels away from home at a constant speed, stops for 10 minutes, and then returns home at a constant speed.”
Be specific when the question asks for times, distances or speeds.
The main things to remember for your GCSE are:
- Read both axes carefully.
- Check the units before calculating.
- Use speed = distance ÷ time.
- A horizontal line means no change in the vertical quantity.
- Explain what each section of the graph represents in the real-life situation.